[ad_1]
The coal industry may have declined in the last decade because of the rise of cheap natural gas, but a coal mining method called mountaintop removal is still taking place, particularly in central Appalachia.
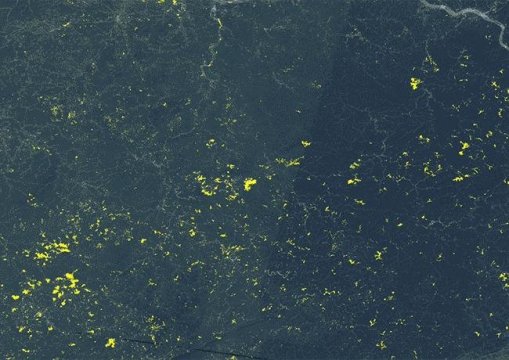
A new web-based mapping tool shows, in more detail than ever before, the land laid bare by mountaintop coal mining in central Appalachia each year, going back more than three decades.
The tool uses satellite imagery to identify and map the annual extent of mining activity across a four-state area including portions of Kentucky, Tennessee, Virginia and West Virginia.
In the journal PLOS ONE, researchers estimate that between 1985 and 2015, an average of 21,000 acres was converted to bare earth and rubble in central Appalachia each year — an area about half the size of Washington, D.C.
This analysis places the total estimate since the 1970s at about 1.5 million acres. “That is an area 18 percent larger than the state of Delaware, and only 3 percent smaller than Everglades National Park,” said first author Andrew Pericak, who conducted the research in the lab of biology professor Emily Bernhardt at Duke University.
Mountaintop mining is a form of surface coal mining in which coal companies clear the forest from a hilltop, then use explosives and heavy machinery to blast and dig through the soil and bedrock and expose the layers of coal underneath. The leftover rock and debris is pushed into adjacent valleys, burying streams under hundreds of meters of rubble called “valley fill.”
Advocates say the process allows mining companies to harvest shallow seams of coal they can’t get at via traditional underground mining. But growing scientific evidence suggests it also destroys forests, fills the air with harmful dust and contaminates nearby streams.
Determining the timing and extent of mining activity is crucial to assessing and mitigating these environmental and human impacts, said co-author Matthew Ross, previously at Duke and now a post-doctoral researcher at the University of North Carolina at Chapel Hill.
But reliable, up-to-date estimates of mining’s footprint are hard to come by. In any given year, a mining company may only be operating within a portion of the area shown on their mining permit. Previous efforts have mapped surface mining in Appalachia using satellite imagery, but these maps haven’t been updated since 2006, and only give a snapshot of mining every 10 years, rather than year-to-year.
The tool developed by Duke researchers, working with partners at the nonprofit organizations SkyTruth and Appalachian Voices, reveals where mountaintop mining is underway on a finer time scale, and makes it easier to keep the data current.
The team used Google’s Earth Engine cloud-computing platform to process U.S. government satellite images of visible and invisible light reflected from the Earth’s surface, taken over 31 consecutive years in a 74-county area.
Each pixel in 10,240 satellite images, going back to 1985, was analyzed by a computer algorithm that used reflectance data to determine the “greenness” of each small square of the image, which represents a 100-by-100-foot square of Earth.
A collection of pixels that appeared largely devoid of vegetation and wasn’t part of a city, road or body of water was labeled as an area where mining was likely occurring that year, with at least 83 percent accuracy in any given year.
“It just took a matter of minutes to output the data set,” Pericak said. “It’s a huge time save.”
The team also combined their mine area estimates with previously published data on coal production. In the 1980s and 1990s, they found, every 100 square feet of land in the region yielded one ton of coal. By 2010, however, coal companies needed to clear and blast about 160 square feet per ton, and by 2015, it took more than 300 square feet.
“It takes more land to get the same amount of coal than it had in the past,” Pericak said.
The results are consistent with what geologists since the mid-1990s have forewarned — that as thicker, more accessible layers of coal are mined out, the ratio of waste rock and soil to coal will increase, along with operating costs, Ross said.
Senior co-author Emily Bernhardt says the updated maps will help researchers come up with more accurate estimates of the costs and benefits of mountaintop mining, and how it compares with other forms of resource extraction.
“Any scientist interested in studying the impacts of mountaintop mining can now see exactly where mines are in the landscape and how long those impacts have been active,” said Bernhardt, who is using the data to understand more precisely how mountaintop mining affects water quality, how far the effects extend downstream and how long they persist.
Indiana University professor Michael Hendryx, who was not involved in the study, has been using the updated maps to assess air pollution exposure and other health effects in people living near active mining sites, compared with people living farther away.
“It also provides the public a better opportunity for monitoring mining operations to ensure they are adhering to the conditions in their permits,” said co-author Christian Thomas of SkyTruth. “Any new problems that crop up could potentially be acted on and corrected more effectively with this annual look at the region.”
Thomas says SkyTruth plans to use the data to measure the effectiveness of reclamation efforts after mining has stopped. “This is the key to helping the region recover from this legacy of mining and transition to a non-mining future,” Thomas said.
The data and computer code are free for anyone to use, and future mining activity can be quickly added to the dataset as new satellite imagery becomes available, Pericak said.
[ad_2]


