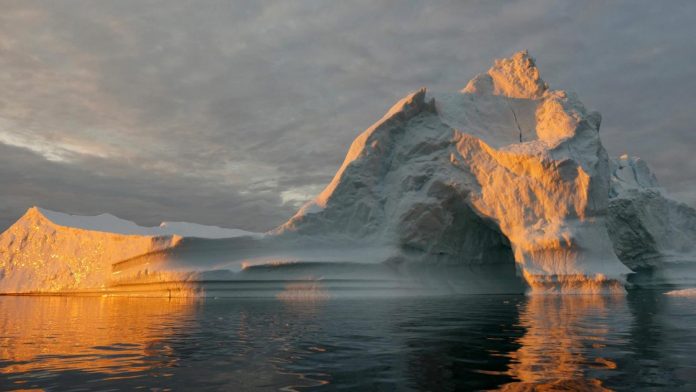
After a brief period of moderate ice loss, the Greenland ice sheet melted in 2019 at the fastest rate ever measured.
Greenland set a new record for ice loss in 2019, shedding the most mass from its giant ice sheet in any year since at least 1948.
The large loss — 532 billion tons — is a stark reversal of the more moderate rate of melt seen in the previous two years. And it exceeds Greenland’s previous record of 464 billion tons, set in 2012. The record melt will likely raise average global sea level by 1.5 millimeters. Using a hypothetical comparison, all the water combined would cover the entire state of California in more than 4 feet (1.2 meters) of water.
The findings were published on August 20, 2020, in the journal Communications Earth & Environment.
“What I found interesting is such a high variability in the rate of loss for the Greenland Ice Sheet,” said Alex Gardner, a researcher at NASA’s Jet Propulsion Laboratory in Southern California and a coauthor of the study. “The years 2017 and 2018 were relatively mild after a decade of record losses, then 2019 came back to set a new record.”
To provide ice-loss estimates for the study, an international team of scientists, including Gardner, combined measurements from the GRACE and GRACE Follow-On (Gravity Recovery and Climate Experiment) satellites with data from computer models that simulate snowfall and ice-sheet melting on Greenland.
Flown between 2002 and 2017, the twin GRACE satellites measured the gravitational pull exerted by massive bodies such as ice sheets: As one satellite passed over a gravitational “bump” on Earth’s surface, it would speed up just a bit, changing the distance between it and its twin. Precise measurements of these changes would yield the “weight,” or mass, of the object below.
GRACE-FO picked up the baton in 2018 and has been continuing to monitor changes in ice mass. Together, the two GRACE missions provide a record of total yearly changes in ice mass now approaching 20 years, allowing scientists to see significant global trends and variations from year to year. Despite a nearly one-year gap in the data record from GRACE to GRACE-FO (July 2017 to May 2018), the total yearly change in ice mass could be measured precisely.
The new findings reveal that climate-related changes in weather patterns over Greenland are a major reason for the large island’s increasing rate of loss, according to glaciologist Ingo Sasgen of the Alfred Wegener Institute in Bremerhaven, Germany, who led the study. The five years with the biggest losses all have occurred in the past decade.
“More and more often, we have stable [atmospheric] high-pressure systems over the ice sheet, which favor the influx of warmer air from the midlatitudes, one of the conditions promoting melt,” Sasgen said. A similar pattern was seen in the previous record year of 2012.
The years 2017 and 2018 were unusually cold and snowy, Sasgen added, leading to a more modest but still pronounced decline in Greenland’s “mass balance” — the difference between ice added by snowfall and subtracted both by ice melt and by the ice flowing into the ocean along the ice sheet’s margins.
In 2019, Greenland returned to the pattern more prevalent in recent years: lower rates of snowfall compared to the long-term average. The computer modeling of regional climate helped reveal weather effects, such as lingering high atmospheric pressure and resulting warm air.
Even as the new study improves understanding of atmospheric effects on Arctic ice melt, others, like NASA’s Oceans Melting Greenland (OMG), track the ocean’s effects. Both are critical to a complete picture of changes over decades.
“When you look at the record as a whole, you start to see the long-term trend becoming more clear,” Gardner said.


